A sample Market forecast graph is depicted in Figure 11.
The Market Forecast screen presents information on a four-year horizon for each of the three customer groups. Each line plots the current size of the customer group as well as the expected size for the next three years.
All numbers are expressed in units and estimates are based on the current market situation. These estimates assume that no substantial changes (introduction of a new brand, significant price increase/decrease) will take place in the future.
Consequently, the forecasts are not always accurate, especially if your organization or the competitors take drastic action during the course of a decision period.
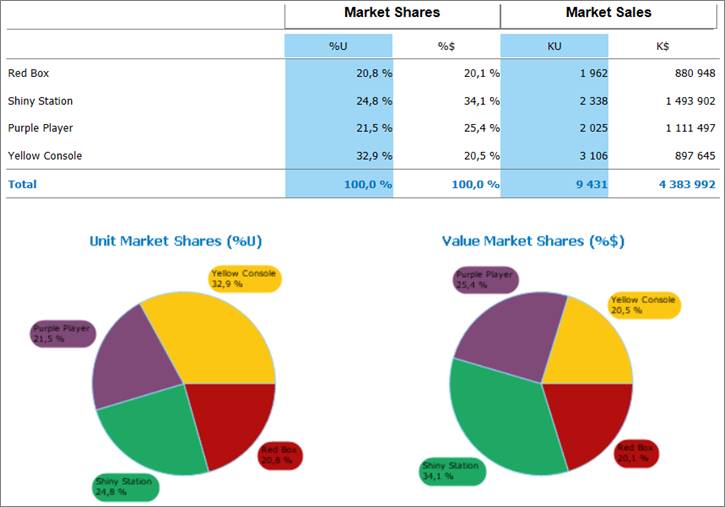
Figure 9 – Market Studies – Sample Sales & Market Shares Chart
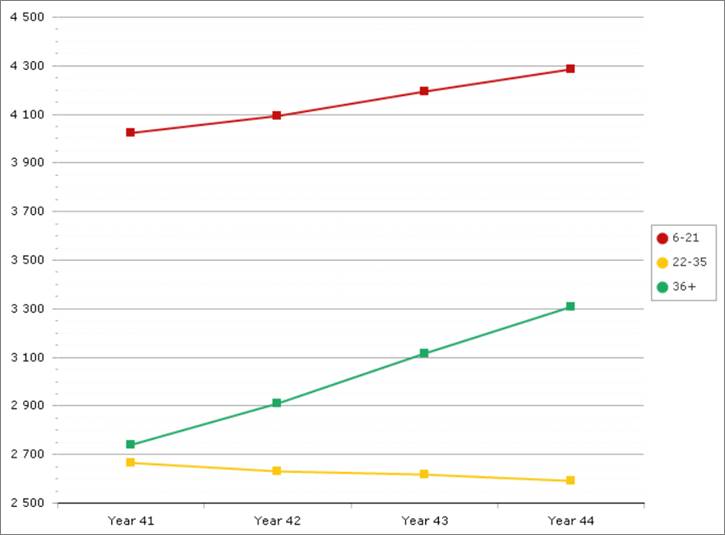
Figure 10 – Market Studies – Sample Market Forecast Chart