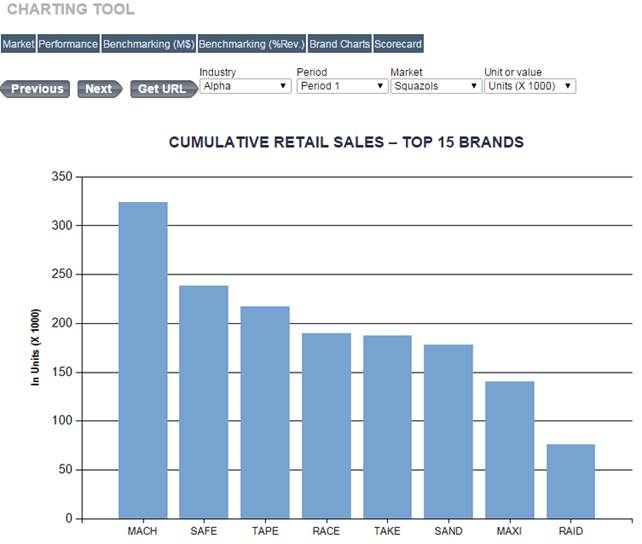
Over 50 graphs can be plotted. They are organized in 5 categories.
•Market. Evolution of selected market data: market sizes and growth rates; segment sizes; number of marketed brands; prices, market average and by consumer segment.
•Performance. Evolution of key performance indicators at firm level: retail sales; sales and shares by market, segment and channel; contribution (profit) per period and cumulative; return on investment; share price index.
•Benchmarking (M$ and %Revenues). Evolution of profit and loss data at firm level: retail sales; revenues; production costs; marketing costs; R&D costs; profit; etc. Benchmarking charts are available in million dollars as well as in percentage of revenues to allow an easier comparison across firms of varying sizes.
•Brand charts. Evolution of key performance indicators at brand level: retail sales; market shares; contribution. Brand charts are available in varying format, for instance top 5 brands across all marketed brands, or only the brands of a selected firm.
Figure 36 – Tools – Charting tool