The Production Report provides you with information on the number of units produced, the number of units in inventory and on production costs for each of the products marketed in the period.
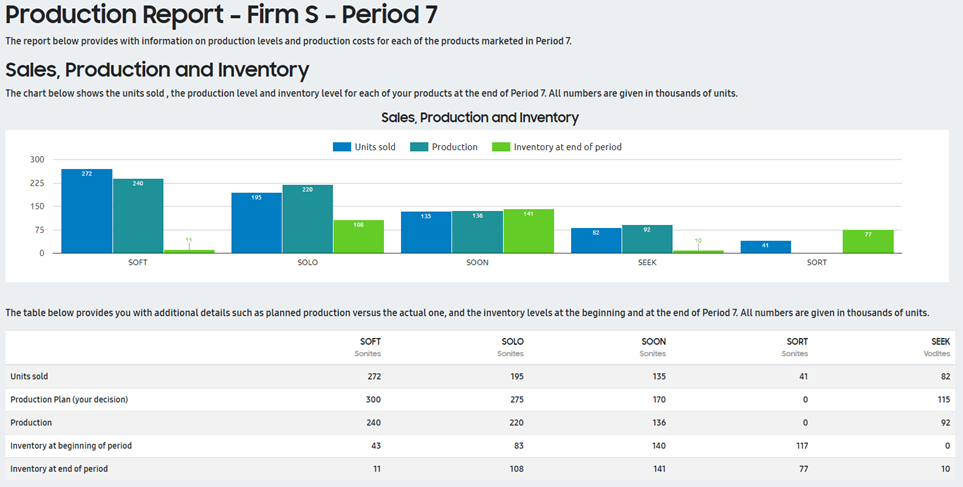
The Sales, Production and Inventory table shows detailed information on planned production versus actual production and the inventory levels at the beginning and at the end of the current period. All numbers are given in thousands of units.
The variation between the production plan (your decision) and the actual production (number of units produced) is due to the automatic adjustment of plus or minus 20%, depending on market demand.
The inventory at the end of period is equal to (inventory at beginning of period + actual production – units sold).

Figure 13 – Production report – Sales, production & inventory
The Unit Cost, COGS and Inventory Holding Cost chart shows the unit transfer cost for each of your marketed products. The current unit cost is the cost of the most recently produced units, while the average unit cost takes into account the units that were in your inventory at the beginning of the period. You may ignore the difference in most cases. Unit transfer costs are given in $; units sold in thousands of units. Cost of Goods Sold (COGS) are equal to Units sold x Average unit transfer cost. COGS are given in thousands of $.
This table also shows the costs incurred for holding your inventory throughout the period. These costs include for instance the storage cost, the cost of capital, etc. Inventory holding cost is equal to Units in inventory x Average unit transfer cost x H%. In the case of a product upgrade or product withdrawal, you must dispose of your inventory at the beginning of the period and a loss is incurred. Inventory disposal loss is calculated as D% of the value of your inventory at the beginning of the period. H and D are given in the market news. Inventory holding and disposal costs are given in thousands of $.