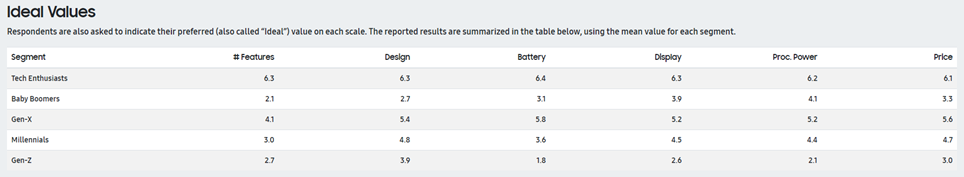
 Figure 25. By comparing the perceived
ratings of your product with the ideal ones for a given segment, you can
determine if this product fits the needs of consumers in that
segment.
Figure 25. By comparing the perceived
ratings of your product with the ideal ones for a given segment, you can
determine if this product fits the needs of consumers in that
segment.This study (presented in detail in Section IV.3.E) describes how consumers perceive the marketed products. Respondents are asked to rate the physical characteristics of each product on a scale from 1 to 7. In the example below, consumers have rated the product MOST at 2.4 on the Power scale because they perceive it as being less powerful than product HOPE, rated at 5.3.
|
MOST (2.4) |
HOPE |
(5.3) | ||||||||||||
|
Low
ê |
|
Average |
ê |
High | ||||||||||
|
|
|
|
|
|
| |||||||||
|
1 |
2 |
3 |
4 |
5 |
6 |
7 | ||||||||
The
study also provides the ideal rating for each characteristic and each
segment. The results of this study are shown in
Figure 24 and Figure 25. By comparing the perceived
ratings of your product with the ideal ones for a given segment, you can
determine if this product fits the needs of consumers in that
segment.