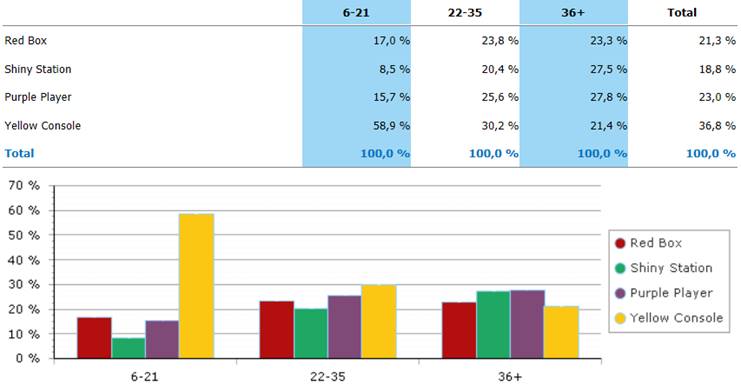
A sample Customer preferences chart is depicted in Figure 8. This is the percentage of customers in a given customer group who would buy a given offering, assuming that they are aware its existence and that it is available in stores.
Customer preferences do not take into account the impact on sales of Communication, Distribution or Geographical Expansion. Hence, the actual market share of a brand might be lower than the preference of customers for that brand; this will happen if its marketing budget is significantly lower than that of its competitors; this will also happen if its coverage of distribution channels or geographical expansion is lower than that of competitors.
Figure 8 – Market Studies – Sample Customer Preferences chart