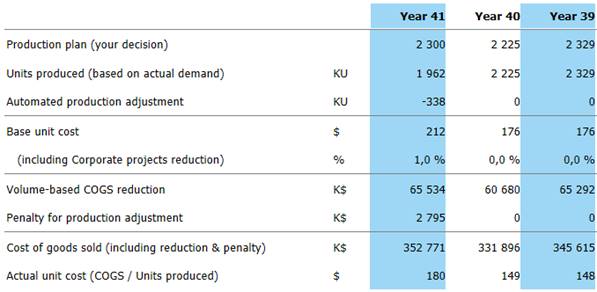
A sample Production Report chart is depicted in Figure 3. This chart allows you to check if your production plan decision was in line with your actual production and to understand the financial implications of your production plan decision.
Each year, you must make a production plan decision to inform the production department of the forecasted sales for the year. The production plan will depend on the forecasted market size and on your expected market share, taking into account the expected moves of your competitors as well as your own marketing and geographic expansion investment plans. Based on your production plan, the Production department will negotiate deals with their suppliers and subcontractors and will agree on a volume-based reduction in COGS.

Figure 3 – Annual Report – Sample Production Report
The Production department is very flexible and will always produce the quantity of units needed. It will produce more units if you are more successful than anticipated and will produce a smaller quantity if you have been optimistic in your forecasting. The Production department will however charge you a penalty for under- or over-production.
Each row of the Production Report is explained in the table below.
|
Production plan |
Reminder of your Production Plan decision made at the beginning of the year. |
|
Units produced |
Number of units actually produced. This is equal to the number of units sold. |
|
Automated production adjustment |
= Units produced – Production plan The higher this number (in absolute value), the higher your error in sales forecasting. |
|
Base unit cost |
Cost for producing one unit of your brand. This cost depends on the physical characteristics of your product as well as of the levels of services and distribution offered by your company. |
|
Volume based COGS reduction |
Total reduction negotiated by the Production department, based on the production plan made at the beginning of the year. |
|
Penalty for production adjustment |
Cost charged by the Production department in case it had to produce more or less units than what was specified in the production plan. The penalty is proportional to the change in production. |
|
Cost of Goods Sold |
= (Units produced x Unit cost) – Volume based COGS reduction – Penalty for production adjustment |
|
Average unit cost |
= Cost of Goods Sold ÷ Units produced This cost takes into account the base unit cost, the cost reduction and the penalty. If you production plan is accurate, the average unit cost will be lower than the base cost. |