This report provides you with revenues, costs and profit information at the company, market and product levels.
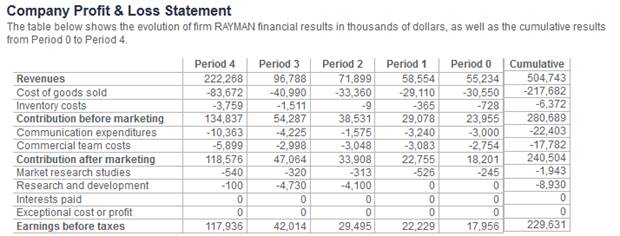
The Profit & Loss statement of your company is illustrated in Figure 12 and is explained below.
•Revenues: Number of units sold x Average selling price. The selling price is equal to the customer price (your decision) minus the distributors’ margin.
•Cost of goods sold (COGS): Number of units sold x Unit transfer cost. The transfer cost is equal to the base cost of the underlying R&D project minus the productivity gains.
•Inventory costs: Inventory holding cost + Inventory disposal loss
•Inventory holding costs: Units in inventory x Unit transfer cost x Inventory holding cost in % (given in the market news report).
•Inventory disposal loss: Loss incurred when selling inventory to a trading company because of a product upgrade or product withdrawal. Units in inventory x Unit transfer cost x Inventory disposal cost in % (given in the market news report).
•Contribution before marketing (CBM): Revenues – COGS – inventory costs.
•Contribution after marketing (CAM): CBM – communication media – communication research – commercial team costs (your decisions).
•Market research studies: costs of the market studies purchased during the period (your decision).
•Research & Development: budgets allocated to R&D projects during the period (your decision).
•Interests paid: Interest paid on loans granted in previous periods.
•Exceptional cost or profit (ECP): Exceptional items such as product withdrawal costs.
•Net earnings: CAM – market research studies – R&D – interests paid – ECP.
Figure 12 –Financial Report – P&L statement
The Market and Product Contribution reports are similar to the company profit & loss statement. They provide financial elements for each marketed product as well as the consolidation of all products by market. A sample product contribution chart is shown on Figure 13.
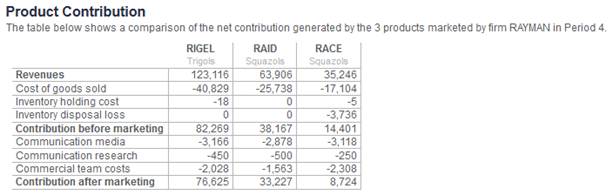
Figure 13 – Financial Report – Product contribution
Finally, the Marketing Results report provides key marketing results for each of your marketed products: market share in volume and value; volume sold and number of customers for each product in each distribution channels; total number of distributors in each distribution channel and proportion of distributors who carry a given product.
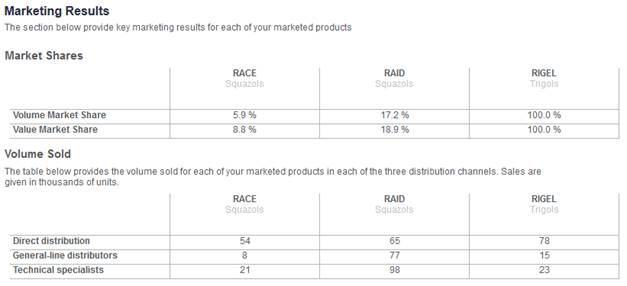
Figure 14 – Financial Report – Marketing results (excerpt)