Conjoint analysis is a statistical technique used to calculate the value – also called utility – attached by consumers to varying levels of physical characteristics and/or price. Conjoint analysis is conducted by showing respondents a set of fictitious products – each having a specific price and specific levels of limited number of attributes – and asking them to sort these products by decreasing order of preference. By analyzing the preference data and the combination of attributes and price for each product, the methodology evaluates the utility attached by respondents to the individual elements making up the product.
This study is rather complex and expensive and is therefore not always made available to participants. Check with your professor if this study will be available in your course. The complexity of the study increases dramatically with the number of attributes and the number of levels included in the study. Hence, only price and the three physical characteristics that are perceived as most important are studied; four levels are tested for each attribute. For instance, the four prices $13, $17, $21 and $25 will be tested.
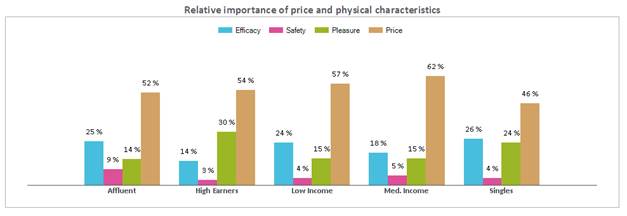
Relative importance of price and physical characteristics. The chart depicted in Figure 35 shows the relative importance of price and the three physical characteristics that are perceived as most important in the market. Note that importance ratings for a given segment sum to 100%.
Utility charts. The charts depicted in Figure 36 show the utilities attached to four arbitrary levels in each dimension included in the study. Utilities are measured on a scale from 0% (very low utility) to 100% (very high utility): the higher the utility the higher the preference of the consumer for the corresponding level in this dimension. The four levels have been chosen in the feasible range for the dimension (e.g.: from 10 to 100 for Pleasure) so as to test varying levels of interest. Results are broken down by consumer segment.
It is important to note that the level with the highest utility is not necessarily the ideal level, as given in the semantic scales or MDS studies. For instance, in Figure 36, the ideal price may be anywhere between $12 and $20.
Figure 35 – Conjoint Analysis – Relative importance of attributes
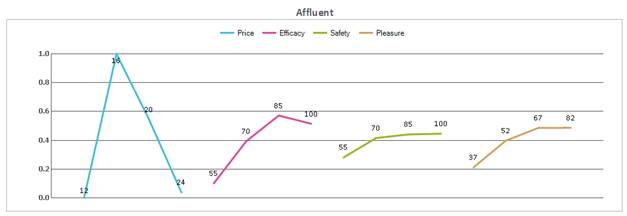
Figure 36 – Conjoint Analysis – Utility charts