The consumer survey is a survey questionnaire administered to 3,000 individuals during the simulated period. It gives brand awareness, purchase intentions and shopping habit data for each consumer segment in the market.
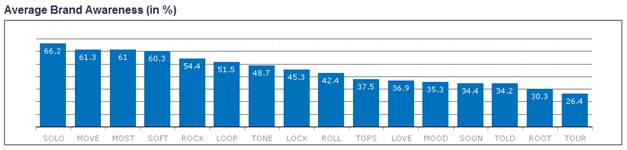
The brand awareness figures represent the proportion of individuals who have unaided recall of a brand name. This is obtained by asking respondents a question such as: “What Sonite brands do you know?” and allowing them to list several brands. The report gives the information for each brand currently on the market in total and by consumer segment. See Figure 18 for a sample graph showing average awareness figures.
Figure 18 – Market Research – Consumer Survey – Average Awareness
The purchase intentions figures represent the proportion of individuals who would select a brand as their first choice, if they were buying within a year. This is obtained by asking respondents a question such as: “Do you intend to purchase a Vodite brand this period?” If the response is yes, then respondents are asked to indicate the brand of their choice. The report gives the information for each brand currently on the market in total and by consumer segment. See Figure 19 for a sample chart. Please note that these figures correspond to the period when the study is done and does not necessarily represent purchase intentions for the following year.
Two points require additional explanations. First, awareness is factored in purchase intentions. Indeed, if respondents are not aware of a specific brand they will not list this brand as the brand of their first choice. Second, purchase intentions are normalized so as to sum up to 100%. This facilitates the comparison between purchase intentions and market shares but it may produce purchase intentions figures that are higher than awareness figures. A typical example is the launch of the first Vodite brand: even if this brand is known by only a few passionate innovators it will have 100% purchase intentions if it is the only one on the market.
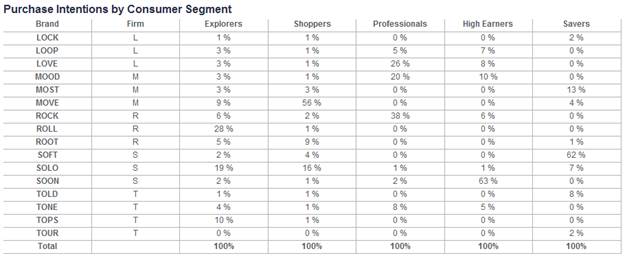
Figure 19 – Market Research – Consumer Survey – Purchase intentions by segment
The shopping habit data represent, for each of the three channels, the proportion of individuals who would choose that channel when shopping for a Sonite or a Vodite product. See Figure 20 for a sample graph.
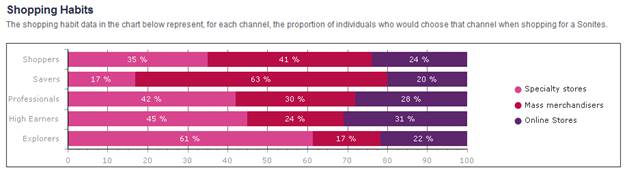
Figure 20 – Market Research – Consumer Survey – Shopping habits