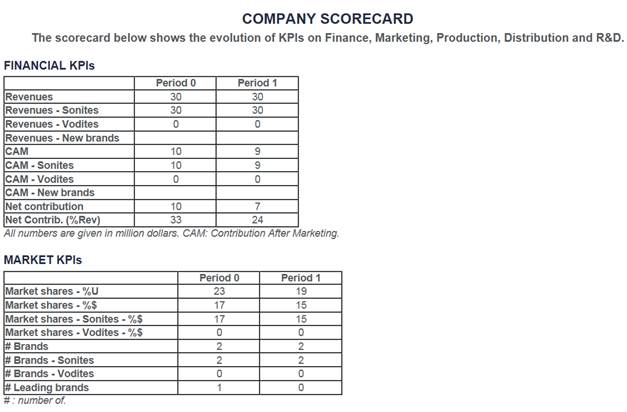
The Company Scorecard shows the evolution of key performance indicators of your company in Finance, Marketing, Production, Distribution and R&D. It allows you to monitor these KPIs over time and check if you are going in the right direction. See example in Figure 37.
•Financial KPIs. Total revenues; revenues in each market; revenues from new brands (other than your two initial brands); Total contribution after marketing (CAM); CAM generated by each market; CAM generated by new brands; net contribution, in million dollars and in percentage of revenues.
•Marketing KPIs. Total market share, in volume and value; market share in each market; number of marketed brands, in total and in each market; number of brands leading in a segment.
•Distribution KPIs. Overall distribution coverage; distribution costs, in million dollars and in percentage of revenues; estimates of lost sales due to insufficient commercial efforts.
•Production KPIs. Volume sold; volume produced; units in inventory; inventory costs; estimates of lost sales due to production shortage.
•R&D KPIs. R&D expenses, in total and in each market; number of completed R&D projects, in total and in each market.

Figure 37 – Tools – Company Scorecard (excerpt)