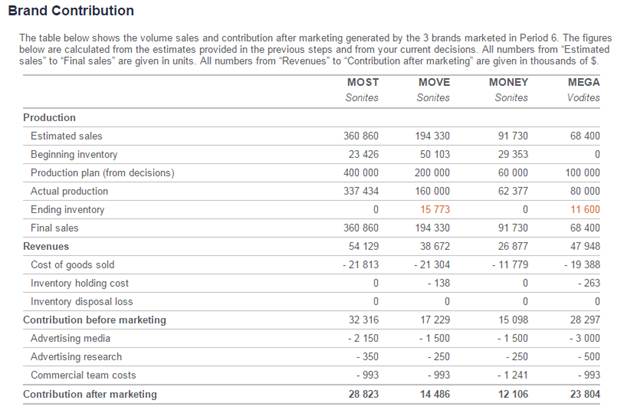
On the basis of your decisions and your estimates for segment sizes and brand shares, the marketing plan tool can make financial projections for the decision period. This form, depicted in Figure 64, shows a pro forma brand contribution statement, similar to the one in your annual report. All calculations are explained below:
(a) Estimated sales: The estimated brand sales based on your market shares (input in step 2) regardless of your production plan decisions.
(b) Beginning inventory: Inventory at the beginning of the period.
(c) Production plan: Your production plan (taken from your decisions).
(d) Actual production: The brand production considering the adjusted production (default +/- 20%)
(e) Ending inventory: Inventory at the end of the period equal to (b) + (c) - (f). If the value is in orange, it means that you will have an inventory for the next year.
(f) Final sales: Brand sales considering your production plan decision and your inventory at the beginning of period. Equal to Minimum between (a) and (d) + (b). If the value is in red, it means that your production and your inventory is not enough to cover all estimated sales.
(g) Revenues: Equal to estimated unit sales × (price – distribution margin), where the distribution margin is calculated based on segment shopping habits, if you have purchased the corresponding study, or is calculated as the average margin of all channels otherwise.
(h) Cost of goods sold: Equal to estimated unit sales × unit cost, where the unit cost is calculated using the same formula as the one in the Markstrat model; this formula takes the experience effect into account, as explained in the Productivity Gains section.
(i) Inventory holding cost: Equal to units in inventory × unit cost × %IHC, where IHC is a factor (usually equal to 8%) that may be customized by your instructor.
(j) Inventory disposal loss: Equal to the number of units disposed of × unit cost × %IDL, where IDL is a factor (usually equal to 20%) that may be customized by your instructor. Inventory disposal loss occurs when a brand is upgraded.
(k) Contribution before marketing: Equal to (g) – (h) – (i) – (j).
(l) Advertising media: Equal to the budget allocated in your decisions.
(m) Advertising research: Equal to the budget allocated in your decisions.
(n) Commercial team costs: Calculated based on your decisions, using the cost of a commercial team person for the decision period; this cost is given in the report entitled Market & Competitive News.
(o) Contribution after marketing: Equal to (k) – (l) – (m) – (n)
This form allows you to check if your brand will be profitable next year and how much contribution it will generate. It may also help you improve your brand result. Here are a few points to investigate.
How can you improve your top line?
•If the product is not right, should you launch an R&D project to improve your brand characteristics?
•Should you increase price to raise your profitability or should you decrease your price to align on competition and get a bigger market share?
•Should you specify perceptual objectives to improve your positioning?
•Should you increase your marketing efforts (advertising & commercial team)?
•Should you focus these efforts on a single consumer segment or should you try to reach two or even three segments to target more consumers?
•Etc.
How can you reduce your costs?
•Should you launch a cost-reduction R&D project to reduce your COGS?
•Should you lower your production plan to get rid of your existing inventory?
•Should you, on the opposite, increase your production to benefit from the experience effect? This is usually a good idea for new brand launches in markets or consumer segments with low volume.
•Is your awareness high enough so that you can reduce advertising spending?
•How does your commercial team compare to the ones of your competitors? Do you really need such a large number of people?
•Etc.

Figure 64 – Marketing Plan – Brand contribution statement