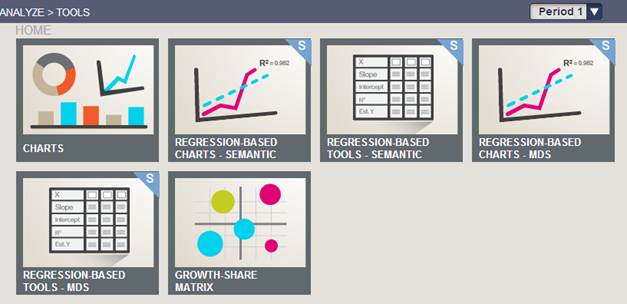
The page shown in Figure 1 pops up when you select TOOLS in the ANALYZE menu. Several categories of tables, graphs and tools are available from this page.
•General charts plotting various data on markets, segments or competitors. These data are extracted from your company results; from the market and competitive news; and from market studies.
•Tables and graphs using linear regressions to predict future ideal point positions or ideal physical characteristics. These tables and graphs are based on both the Semantic Scales and Multidimensional Scaling studies.
•Interactive tools using linear regressions to predict to position of new product offerings on brand and perceptual maps; or to determine which product offering would be appropriate to reach a certain position on these maps.;
•Growth/Share matrices, also called Boston Consulting Group (BCG) matrices to help you allocate your resources across multiple offerings.
Figure 1 – Analyze > Tools > Home page