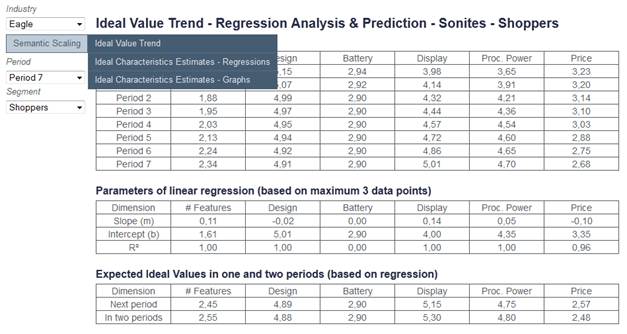
Most of the elements listed above are accessible through the web page depicted in Figure 2. The top-left menu gives you access to the various pages in the selected category.
Then, you can further configure the table or graph by using the choice boxes listed below the menu. The exact list of choice boxes will depend on what element you are looking at. For example, you may be able to zoom in a particular market, segment or channel; to select which dimensions to plot in a map; or to view data in volume or value.
Finally, the selected page may contain several tables or graphs, as shown in Figure 2, so make sure to scroll down so as to view the entire report.

Figure 2 – Analyze > Tools > Sample page