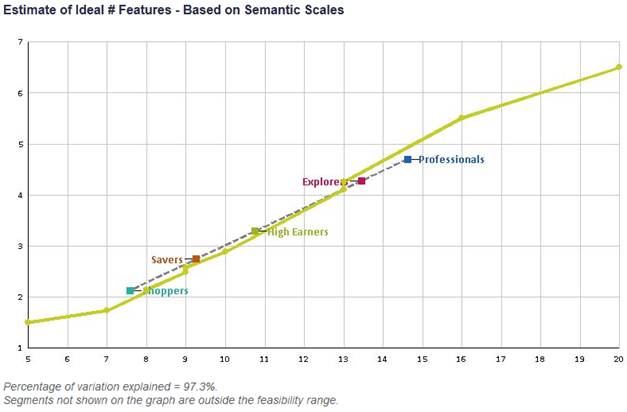
This page shows a graphical representation of the relationship between physical characteristics and perceptions. It is obtained by plotting the actual characteristics of all marketed brands on the horizontal axis and the corresponding perceptions on the vertical axis. Each marketed brand corresponds to a data point on the graph. There is one such graph for each dimension: processing power, display size, etc. The segment ideal values are indicated on the vertical axis. See an example in Figure 5.
The best-fit line is added to the chart. It is used as a first approximation of the real curve to build some the tables and tools available in Markstrat. The current position of ideal points is also represented on the graph.
The percentage of variation explained of the regression is given in the footnote. This is another name for R². When this percentage is close to 100%, it indicates that the actual curve and the line are close to each other and that approximating the curve by the line will give meaningful results.
Figure 5 – Regression Analysis – Semantic Scales > Graph & Best-Fit Line