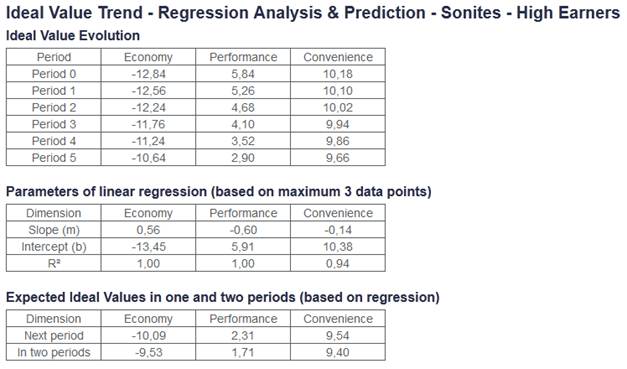
This page is specific to the selected market and segment. It allows you to monitor the evolution of ideal points on perceptual maps and to predict where they will be in one or two periods. See an example in Figure 7.
The first table shows the evolution of ideal values over the past periods for each dimension of the Multidimensional Scaling study. All numbers are extracted from this study and are given in the scale from −20 to +20.
The second table shows the formula (slope and intercept) of the best-fit line, also called linear regression. Note that only the past three data points are used to calculate the best-fit line. The formula can be read as:
Ideal Value at Period P = (Slope × P) + Intercept
If the R² is close to one, then this formula can be used to predict future ideal point values. The third table provides these values in one and two periods.
Figure 7 – Regression Analysis – Multidimensional Scaling > Ideal Value Trends