The graphs described in the previous section analyze the influence of physical characteristics on multidimensional scaling (MDS) dimensions one by one. For instance, a given graph will show how Processing Power influences Performance.
The market is more complex. Indeed, we know from the multidimensional scaling study that dimensions such as Performance or Convenience are influenced by multiple physical characteristics. For instance, Performance may be influenced by Processing Power and Display Size (Power and Maximum Pressure in the Business-to-Business version; Efficacy and Safety in the Consumer Goods version).
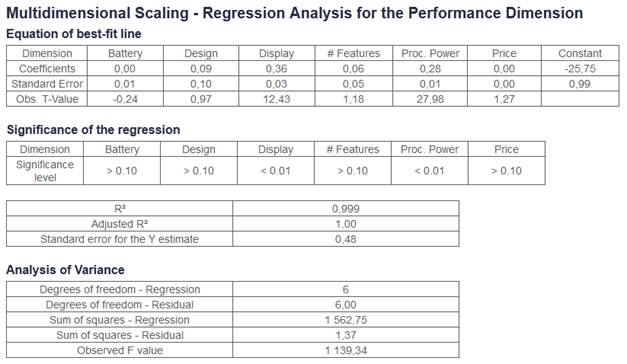
Markstrat calculates a multivariate regression analysis to determine which physical characteristics influence a given MDS dimension. See an example of this analysis in Figure 9. The solution is given in the first table. For a product offering with given levels in Battery Life, Design, …, Processing Power and a certain Price, its perception in Performance can be calculated as:

The other two tables give the regression statistics. The significance level indicates if a given characteristic influences the dimension or not. A characteristic with a significance level above 0.10 has no influence on the dimension. On the contrary, a characteristic with a significance level below 0.01 has a very strong influence on the dimension. The R² measures how well the formula explains the perception variations. The closer the R² is to 1, the more significant the formula is.
The formula can be used in two ways.
•To determine how a product with given physical characteristics and a given price is likely to be perceived on the perceptual map.
•To find a combination of physical characteristics and price that will reach a target position on the map. Because the formula has several degrees of freedom, usually up to 6, multiple combinations can be found.
A tool is provided to help you use the above formula. See the section XYZ.

Figure 9 – Regression Analysis – Multidimensional Scaling > Multivariate Regression Analysis