This study provides a joint space configuration obtained with non-metric multidimensional scaling. It relies on similarity and preference data on the complete set of products available in the market. These data were obtained through interviews with 200 individuals. Several charts and graphs are given in this study, as explained in the next few paragraphs.
Perceptual Maps. The study gives the minimum number of dimensions that are sufficient to provide a good fit to the data. In the case of the Sonite product category, three dimensions are necessary: Economy, Performance and Convenience. Then, the study provides a graphical representation of the perceptual positioning of the marketed products.
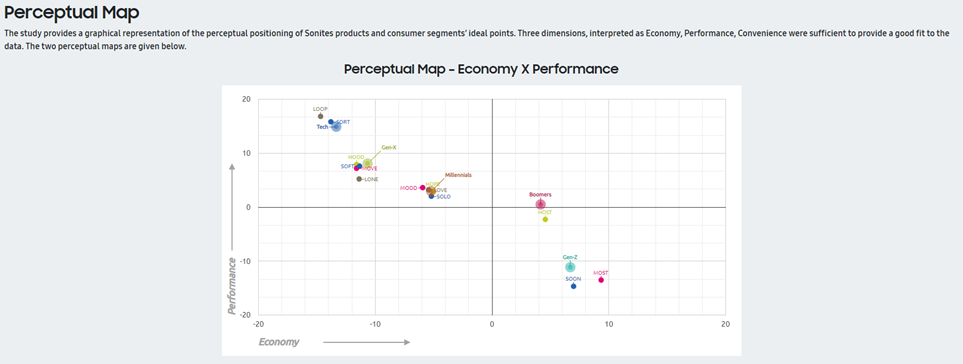
Respondents are also asked to indicate their preferred (also called “Ideal”) position on the map. The reported results are summarized on the map, using the mean value for each segment. A sample perceptual map is depicted in Figure 27.
Obviously, only two dimensions out of the three can be represented simultaneously. The circles Ex, Sh, Pr, Hi, and Sa on the graph represent the ideal points of the five segments, i.e. the average position of the whole segment. The various geometric shapes (square, triangle, star...) correspond to the positioning of the products as they are perceived by the market at the time of the study. Each product name is clearly labeled. One specific color and shape is attributed to each firm (for example, all products marketed by firm M is represented by blue circles).
One key difference between this study and the semantic scale one is that the dimensions on which to evaluate the products are not given to the respondents. Instead, they are identified by the methodology from the respondents’ data.
Building a perceptual map is a complex task that requires many data points. Hence, this study will not be available for the Vodite product category until several products are marketed in the category.
Two tables give the coordinates of the product positions and of the consumer segment ideal points on the perceptual map, on a scale from -20 to +20.
Ideal value evolution. The study monitors the evolution of consumer needs over time. For each consumer segment the preferred values on each dimension over the past 3 years are recorded and displayed in a table.
Influence of Product Characteristics on Perceptual Dimensions. We will see in the chapter Positioning and Research & Development that the MDS study is useful in positioning products. This is why it is important to relate the three dimensions identified by the MDS study to the most important physical characteristics of the category. An indication of the influence of product characteristics on perceptual dimensions is provided in a table such as the one in Figure 28. For example, you may see that “Performance” is strongly related to “Processing Power” and moderately to “Display Size”, while “Convenience” is strongly related to “Design” and only slightly related to “Battery Life” or “Features”.
Additional graphs. The charts and graphs listed above are given in the main report of the study. Two additional series of charts can be found by clicking on a link at the top of the study. The first series will provide you with a graphical representation of ideal point evolution since the beginning of the simulation. The second series shows the relationships that exist between product physical characteristics and product perceptions. These charts are mostly used to design R&D projects are discussed in more details in chapter VI.
Figure 27 – Market Research – MDS Study – Perceptual map (Economy X Performance)
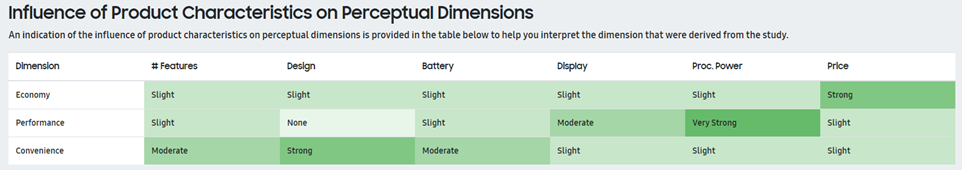
Figure 28 – Market Research – MDS Study – Influence of Product Characteristics