Let’s suppose that you want to determine the processing power (in gigaflops) that corresponds to a performance of 10 on the scale -20 to +20.
A methodology similar to the one applied to semantic scales can be used with multidimensional scaling data. The main difference is that there is not a one-to-one relationship between MDS dimensions and physical characteristics. Instead, each dimension is related with two or more physical attributes. For instance, performance is strongly linked with processing power and display size. Hence, the desired coordinate in performance will be used in two interpolations, one to determine the matching processing power and one to determine the display size.
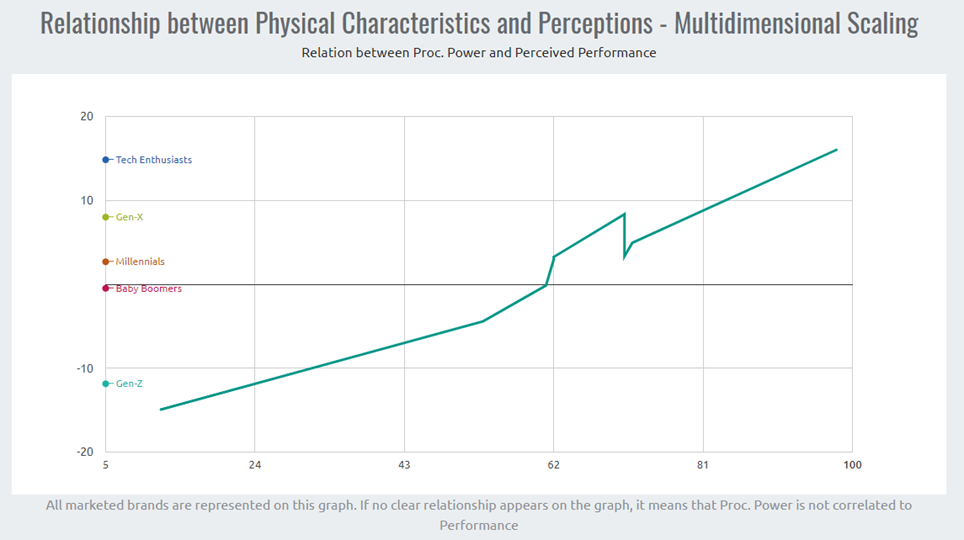
A graph such as the one depicted in Figure 55 will facilitate the interpolation process. This graph is available in the additional graphs, accessible through a link at the top of the study. It is obtained by plotting the actual characteristics of all marketed products on the horizontal axis and the corresponding perceptions on the vertical axis. Each marketed product corresponds to a data point on the graph. There are 18 such graphs, one for each couple “physical characteristic × MDS dimension”; for instance, Processing Power × Performance, Display Size × Performance, etc. The segment ideal values are indicated on the vertical axis.
Some of these charts are meaningless. For instance, the graph Design × Performance is unlikely to provide useful information as Design is not related to Performance. Obviously, you should not use performance to determine a level in Design or Battery Life because these dimensions are not related to one another.
Doing the interpolation is straightforward with the appropriate graph. Simply plot the desired coordinate on the vertical axis, 10 in our example. Follow a horizontal line until you intersect the green curve, and then follow a vertical line starting at the point of intersection. You can now read the physical characteristic (in gigaflops) corresponding to the desired position 10. This is 82 in our example.
The curve on our example is not exactly a straight line. This is the case when several products have been positioned or repositioned through advertising and perceptual objectives. Some readings are more difficult to do; for instance, a desired coordinate of 5 gives a characteristic comprised between 60 and 68 gigaflops. In such a case, you will have to use your judgment. This is also true in case the Semantic Scales study and the MDS one give two different readings.
Repeat the process above for each dimension where you need to find the physical characteristic corresponding to a desired coordinate.
Figure 55 – Relationship between attributes and perceptions – MDS study