Let’s suppose that you want to determine the processing power (in gigaflops) that corresponds to the coordinate 5 on the 1 to 7 scale.
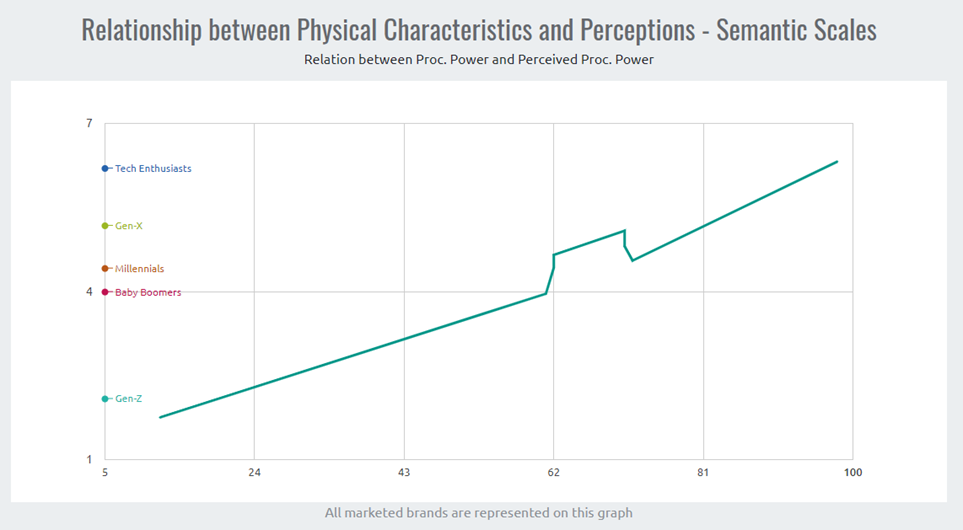
A graph such as the one depicted in Figure 54 will facilitate the interpolation process. This graph is available in the additional graphs, accessible through a link at the top of the study. It is obtained by plotting the actual characteristics of all marketed products on the horizontal axis and the corresponding perceptions on the vertical axis. Each marketed product corresponds to a data point on the graph. There is one such graph for each dimension: processing power, display size, etc. The segment ideal values are indicated on the vertical axis.
Doing the interpolation is straightforward with this chart. Simply plot the desired coordinate on the vertical axis, 5 in our example. Follow a horizontal line until you intersect the green curve, and then follow a vertical line starting at the point of intersection. You can now read the physical characteristic (in gigaflops) corresponding to the desired position 5. This is 69 in our example.
The curve on our example is almost a straight line. This is not always the case, especially when several products have been positioned or repositioned on the market using perceptual objectives.
Repeat the process above for each dimension for which you need to find the physical characteristic corresponding to a desired coordinate.
Figure 54 – Relationship between attributes and perceptions – Semantic scales study