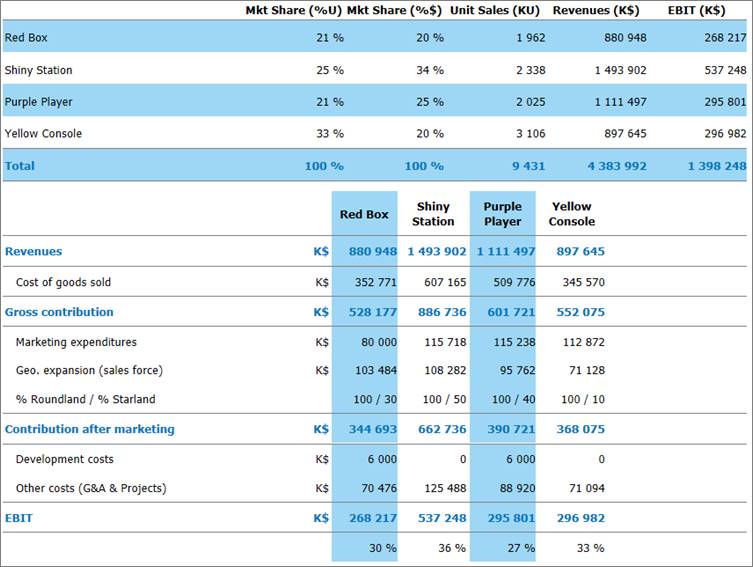
A sample “Benchmarking” chart is depicted in Figure 7. It provides you with essential information on all marketed offerings, including yours, and allows you to compare your performance with that of competitors. As this chart is updated each year, it also allows you to monitor your performance over time. There are four key performance indicators: market shares in units and in value, revenues and EBIT.
This chart also shows a comparison of Profit & Loss statements for all offerings. Refer to the section Profit & Loss Statement for a detailed description of the Profit & Loss statement.
Figure 7 – Market Studies – Sample Benchmarking Chart