Marketing strategy concerns the allocation of resources to businesses that a firm wants to be in and the allocation of resources to the marketing-mix variables for each brand across businesses.
One approach to the analysis of product/market portfolios is to represent the various businesses in which the firm operates on a two-dimensional map. This map offers diagnostic information on the position of the firm and shows how the various businesses in which the firm is involved fit together.
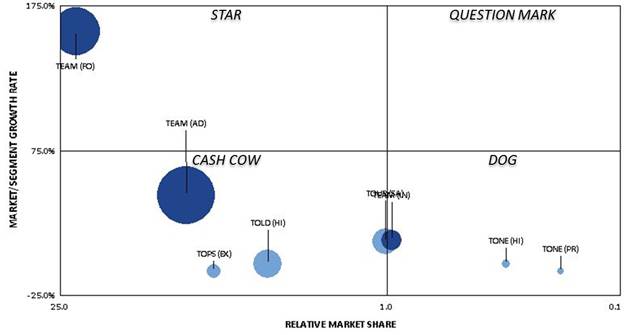
The Boston Consulting Group has proposed using market growth and relative market share as the two dimensions of the map. This map, called Growth/Share Matrix, is available in Markstrat. Select TOOLS in the ANALYZE menu and click on the appropriate icon. An image such as the one in Figure 16 is displayed. Growth/Share matrices are available for the entire portfolio or market by market. You may also plot the portfolio of your competitors; this will give you some good insights on their past and future strategies.
You will find in the next paragraphs a general discussion of portfolio analysis: what is the rational for portfolio analysis; why use market growth and relative market share; what should be an ideal portfolio; pros and cons of this tool; etc.
Figure 16 – Sample Markstrat Portfolio