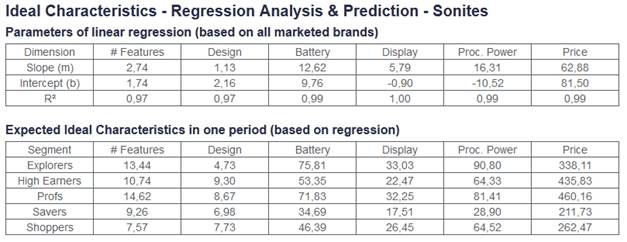
This page gives the formula of the best-fit lines used to approximate the relationships between physical characteristics and perceptions. It also predicts what will be the ideal product characteristics for a given market and segment in future periods. See an example in Figure 6.
The first table shows the formula (slope and intercept) of the best-fit line for each physical characteristic. This is the mathematical formula of the dotted line shown on Figure 5. It can be used in two ways.
•To determine what level L in a given physical characteristic (e.g. processing power) is necessary to achieve a target perception P:
L = (Slope × P) + Intercept
•To determine how a product with a level L in a given physical characteristic is likely to be perceived:
P = (L − Intercept) ÷ Slope
If the R² is close to one, then this formula is likely to produce meaningful results.
The second table shows what the ideal characteristics are likely to be in one period. The calculations are done with the formula described above and the future values of ideal points given in section Ideal Value Trend. The results are given in the appropriate units: gigaflops, inches, lines/mm, etc.
Figure 6 – Regression Analysis – Semantic Scales > Regression Analysis & Prediction