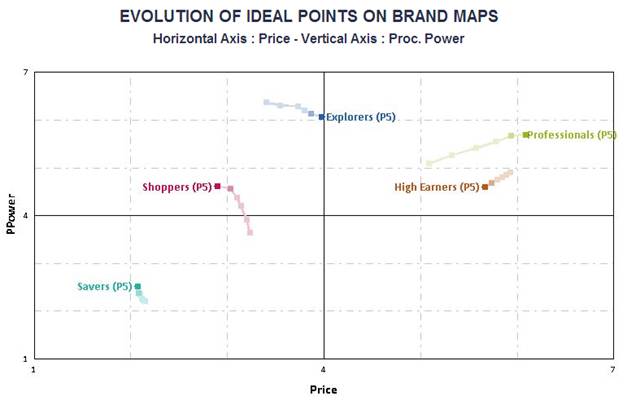
The graph depicted in Figure 18 is available in the Semantic Scales and Multidimensional Scaling studies. It shows the evolution of ideal points since the beginning of the simulation. The latest data point is the one with the strongest color. All dimensions and periods can be plotted by using the choice boxes on the left-hand side, as explained in section I.2.
Consumer needs evolve over time. This may be due to changes in the environment, for instance a more or less favorable economic situation, or to new trends or new ways to use Sonites and Vodites products. Consumer needs are also influenced by the actions of competitors, for instance when new products are introduced on the market or when strong advertising campaigns around specific attributes are done.
None of these reasons will create the conditions for drastic changes in consumer needs. On the opposite, the tracking of the position of ideal points on the map show that this evolution is fairly gradual and regular. This graph helps you predict where ideal points will be in future periods.

Figure 18 – Ideal Point Evolution