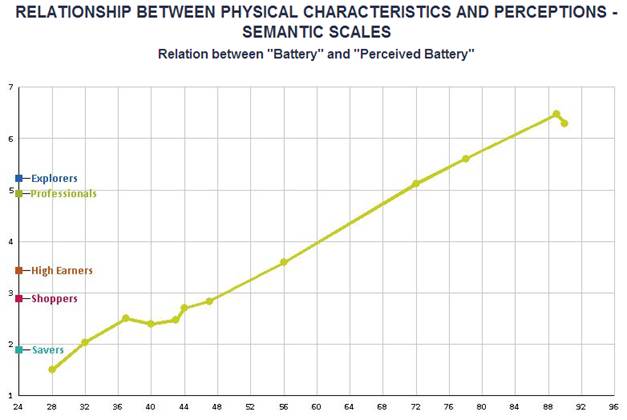
The graph depicted in Figure 19 is available in the Semantic Scales study. It is obtained by plotting the actual characteristics of all marketed brands on the horizontal axis and the corresponding perceptions on the vertical axis. Each marketed brand corresponds to a data point on the graph. There is one such graph for each dimension: processing power, display size, MTBF, efficacy, etc. The segment ideal values are indicated on the vertical axis. All dimensions and periods can be plotted by using the choice boxes on the left-hand side, as explained in section I.2.
This series of graphs are mostly used to design R&D projects and are discussed in more details in chapter VI of the handbook. We invite you to refer to this document for further explanations.

Figure 19 – Relationship between Physical Characteristics and Perceptions – Semantic Scales